Tech Talks: Kibana Introduction
Initial steps in server monitoring using Kibana and Elasticsearch — collecting Spring Boot metrics and building a visualization dashboard.
This tech talk covered initial steps in server monitoring, alongside a basic introduction to Kibana and Elasticsearch technologies.
What to Collect?
The team began with pre-existing Spring Boot metrics. To transform input data — computing differences between snapshots and tallying summary hits for various status codes — they built a simple utility tool that reads metrics and feeds them into Elasticsearch. They additionally implemented email notifications for error cases. While Logstash could have been considered, it wasn't deemed straightforward for their needs.
Prepare E(L)K
The official Docker images were deployed. Once operational, Kibana indices required setup before visualization experimentation could commence. Date Histogram proved most useful in typical cases, though Terms aggregation also yielded interesting statistical insights.
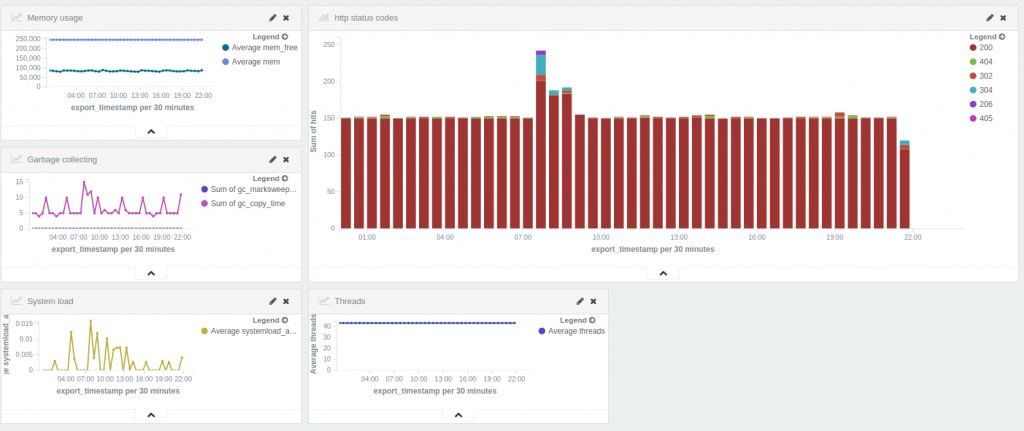
The resulting dashboard displayed the following visualization: